How to graph a linear function by hand
A straight-line graph does not require a graphing calculator. Start with the y-intercept, use the slope to place a second point, then draw the line. This lesson works for learners meeting linear functions in secondary mathematics and for tutors explaining them online.
What does y = 2x + 1 tell us?
A linear function in slope-intercept form is written as y = mx + b. The number b tells you where the graph crosses the vertical (y) axis; m is the slope, or change in y for each one-unit increase in x. For our example, b = 1 and m = 2.
Put a point at (0, 1). A slope of 2 = 2/1 means move one unit to the right and two units up, landing at (1, 3). Repeat to reach (2, 5). Connect the points with a straight line and extend it in both directions.
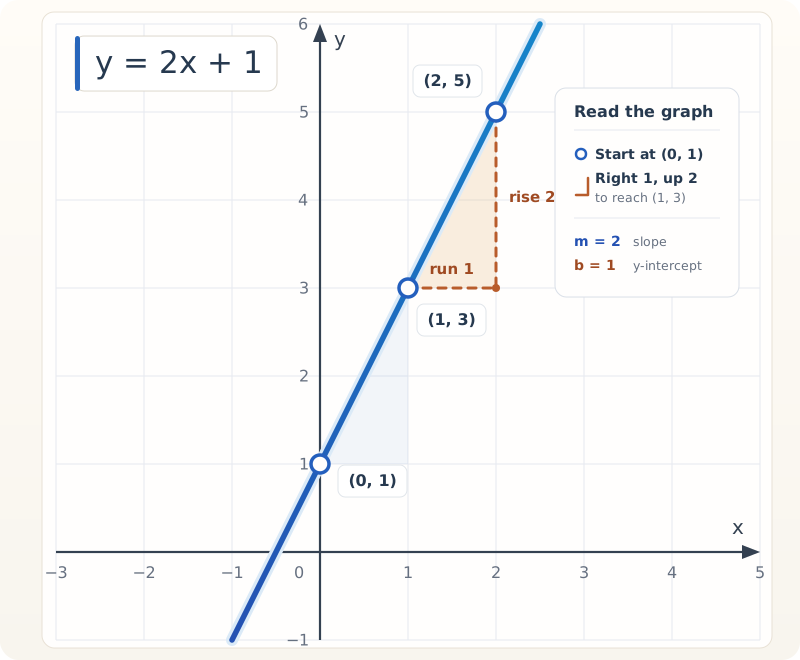
View the full-size graph illustration if the labels are too small on your screen.
Check the points before drawing
You can calculate a few coordinates by substituting x into y = 2x + 1. The points must line up because the change in y stays equal to twice the change in x.
| x | Calculation | y | Point |
|---|---|---|---|
| −1 | 2(−1) + 1 | −1 | (−1, −1) |
| 0 | 2(0) + 1 | 1 | (0, 1) |
| 1 | 2(1) + 1 | 3 | (1, 3) |
| 2 | 2(2) + 1 | 5 | (2, 5) |
The table is a check, not a prerequisite: once you understand the intercept and slope, two distinct points determine the line.
Recreate the example on MathBoard
- Open the board. Choose Stamps and insert the Cartesian plane kit. It supplies the axes and labels, not a numbered grid or a plotted function.
- Set a scale. Use the Pen or Line tool to mark evenly spaced unit ticks on both axes. Label the units with Text. The same physical distance must represent one unit on each axis for the slope triangle to look proportional.
- Mark the intercept. Use the Pen or Circle tool to mark (0, 1). From there, count one tick to the right and two ticks upward to mark (1, 3); repeat for (2, 5).
- Draw the line. Use the Line tool to connect the points and extend the straight line. You are drawing it manually; MathBoard does not automatically plot an equation.
- Add an editable equation. Choose Formula (shortcut F),
enter
y = 2x + 1, check the preview and insert it beside your graph. Select the formula later to edit it again. - Explain the movement. With the Pen or Line tool, draw a horizontal run of 1 and a vertical rise of 2 between two consecutive points; annotate them with Text.
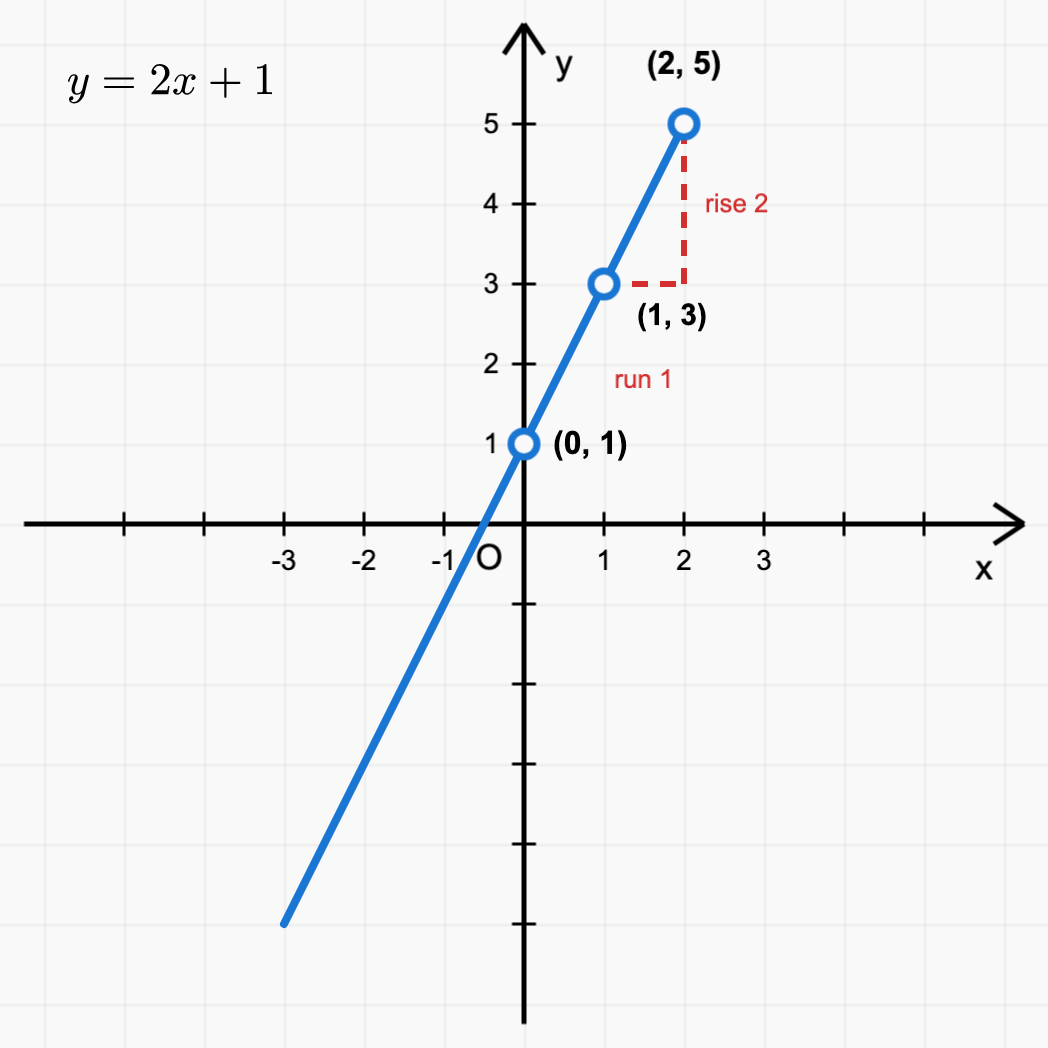
Open the full-size MathBoard capture if the labels are too small on your screen.
Open this finished graph in MathBoard
The link loads the example as a stamp. It replaces the board currently saved in this browser, and the graph arrives as one group you can ungroup and edit.
For help with notation, see the LaTeX whiteboard guide. The same workflow works during a video call using your normal screen-sharing software. MathBoard is a drawing surface, not a built-in live graphing calculator.
Try another line: y = −x + 2
Ask the learner to find the new y-intercept, plot a second point and explain why the line slopes downward. Use exactly the same axes and one-unit spacing. Let them predict where it crosses the x-axis before showing the answer.
Check the worked answer
The intercept is (0, 2). The slope is −1: move one unit right and one unit down to get (1, 1). Another step gives (2, 0), so the x-intercept is 2. The slope is negative because y decreases as x increases.
Two mistakes worth discussing
- Starting at x = 1 instead of y = 1. In y = mx + b, b is the y-value when x = 0, so the first point lies on the vertical axis.
- Treating slope 2 as “move right two”. Think of 2 as 2/1: move up two units for each one unit to the right. Equal spacing makes that visible on the drawing.
For additional background on coordinates, see OpenStax's coordinate-system chapter. This worked example and diagram were written for MathBoard rather than copied from that resource.
Explain it on your own board
Build a line, annotate the slope and invite the student to predict the next point. MathBoard is free, open source and works in the browser without an account.